Top 100 Retailers 2019
When reading about the financial prowess of the retail segment and its major players, the sheer magnitude of the numbers can be daunting. Millions, billion, trillions, all of these numbers can lose their meaning, and leave you wondering what it all means.
To put these number in perspective, for the second straight year RIS ranked the top 100 publically traded retailers on not just total revenue, but rather on the percentage of market share they control. This gives the results a little more context on which to compare the individual companies.
Our research partner, Gary A. Williams, CEO, wRatings examined more than 300 publicly traded global retailers and calculated their share of the retail market. For this ranking, the retail market is the sum of the revenue for all the retailers examined, valued at around $3.2 trillion, an increase of more than $230 billion. The resulting list is a who’s who of the global retail marketplace ranked on their economic might.
The full listing of 100 retailers can he viewed here. Below is a look at the top 5 finishers.
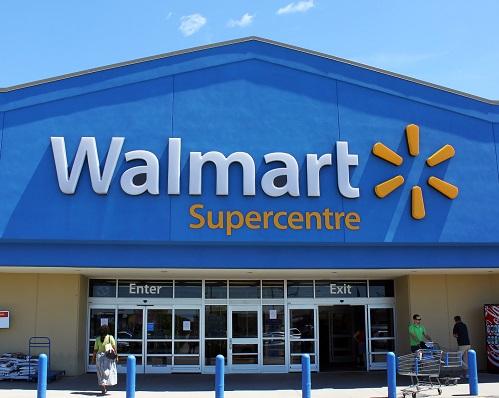
Walmart
For the second year in a row Walmart tops our ranking. The world’s biggest retailer collects a whopping 16% of the retail market, which is actually down from the 17% of market share observed last year. The retail behemoth grew its revenue to $515 billion over the past year, doubling second place finisher Apple’s revenue take. Despite the massive overhead Walmart must maintain thanks to its sprawling physical presence and ongoing battle with Amazon for digital supremacy, the retailer still turned a $129 billion profit, best for highest overall, besting Apple by more than $20 billion.
Apple
As a manufacturer, software provider and cutting-edge retailer, Apple draws revenue from many sources, helping it claim 8% of the total market. Its finished in second place for the second consecutive year, but saw its market share dip slightly while Amazon’s increased, leading to a narrower edge over third-place finisher Amazon. In the retail hardlines breakout of this research, Apple truly shined, taking in 55% of the available market just as it did last year. Its total revenue was up $11 billion over last year finishing at $258 billion, with a gross profit of $112 billion.
Amazon
Amazon finished in third place for the second year in a row, but it is closing ground quickly on second-place finisher Apple, while continuing to distance itself from the competition in the rear view. The omnichannel retailer captured 7.5% of the total retail marketplace, up from 6.5% last year. In addition, it owns 33% of the e-commerce market, up .3% year-over-year. The online giant increased its overall sales figure by nearly $50 billion to $241 for the year, while profits increased more than $30 billion to $109 billion.
Costco
Costco is holding steady in fourth place with 4.6% of the available market, up slightly from last year’s 4.5% capture. In the struggling department store segment Costco has seen modest gains upping its market share from 14% last year to 14.8% this year. The warehouse membership retailer saw significant gains in sales over the past year, increasing its top line from $135 billion to $149 billion. And on the gross profit front, Costco saw its bottom line increase from $17.1 billion to $18.4 billion, an impressive 7.6% increase.
Kroger
Kroger, like top finisher Walmart, actually saw its overall market share decrease year-over-year, dropping from 4.1% to 3.7%. Despite the drop in market share the grocery powerhouse maintained the same fifth-place position it occupied in last year’s ranking. In the increasingly competitive grocery segment, Kroger also endured a reduction in market share, relinquishing nearly 2% of its position, falling to 36.5% of the market overall. In addition, both sales ($120 billion) and gross profit ($26 billion) took significant setbacks year-over-year.
METHODOLOGY
Research partner Gary A. Williams, CEO, wRatings, examined the financial metrics of 319 publicly traded retailers. The economic data is from a 12-month period ending on June 30, 2019. The percent of retail market share was calculated against a total retail market of around $3.2 trillion. The research ranked retailers across the specialty, apparel, department store, grocery and e-commerce segments.


